Grafana Cloud (Optional)
Grafana Cloud is an optional observability add-on for the cloud VM deployment. The control plane exposes a standard Prometheus metrics endpoint and writes structured JSON logs; this page describes how to wire those up to Grafana Cloud using Grafana Alloy so you can query metrics and logs from anywhere. Nothing in the application itself depends on Grafana Cloud, so this setup is entirely skippable.
Prerequisites
- A Grafana Cloud account. The free tier (10,000 active series, 50 GB logs, 14-day retention) is sufficient.
- The cloud VM already bootstrapped per Google Cloud Deployment.
Getting your credentials
You need five values from the Grafana Cloud portal. Open your stack at grafana.com and find them as follows:
Prometheus remote-write URL and instance ID
Open the Prometheus / Metrics card and click Details. The remote-write URL looks like:
https://prometheus-prod-XX-prod-us-central-0.grafana.net/api/prom/push
The numeric instance ID (username) is shown on the same page.
Loki push URL and instance ID
Open the Loki / Logs card and click Details. The push URL looks like:
https://logs-prod-XXX.grafana.net/loki/api/v1/push
The numeric Loki instance ID is shown separately from the Prometheus one.
Cloud Access Policy token
Go to Security → Access Policies, create a new policy, and add both metrics:write and logs:write scopes. Generate a token; one token covers both pipelines. It will look like glc_eyJ....
Populating GCP Secret Manager
With the values from above, populate the five secrets Terraform created:
echo -n 'https://prometheus-prod-XX-prod-us-central-0.grafana.net/api/prom/push' \
  | gcloud secrets versions add coderunner-grafana-cloud-url --data-file=-
echo -n '<numeric-prometheus-instance-id>' \
  | gcloud secrets versions add coderunner-grafana-cloud-user --data-file=-
echo -n '<glc_eyJ...-access-policy-token>' \
  | gcloud secrets versions add coderunner-grafana-cloud-token --data-file=-
echo -n 'https://logs-prod-XXX.grafana.net/loki/api/v1/push' \
  | gcloud secrets versions add coderunner-grafana-cloud-loki-url --data-file=-
echo -n '<numeric-loki-instance-id>' \
  | gcloud secrets versions add coderunner-grafana-cloud-loki-user --data-file=-
Then re-render the VM's .env and recreate the Alloy container so it reloads
the rendered config:
gcloud compute ssh coderunner --zone=us-central1-a --tunnel-through-iap \
  --command="sudo /opt/coderunner/render-env.sh && cd /opt/coderunner && sudo docker compose up -d alloy"
Secret names are defined in deploy/terraform/secrets.tf.
Service management
Alloy runs as a compose service on the VM (/opt/coderunner):
cd /opt/coderunner
sudo docker compose ps alloy
sudo docker compose restart alloy
sudo docker compose logs -f alloy
What is shipped
Metrics: Alloy scrapes control:4000/metrics (over the compose network) every 30 seconds and remote-writes to Grafana Cloud Prometheus. It also collects host-level metrics (CPU, memory, disk, network) via the built-in Unix exporter — it reads the host's /proc, /sys, and / through bind mounts since Alloy is containerized — labeled with the instance value from instance_label in terraform.tfvars.
Logs: the control plane writes JSON to stdout, captured by Docker's json-file log driver. Alloy's discovery.docker finds the control container and loki.source.docker ships its log lines to Loki. The pipeline extracts level and category as Loki labels; high-cardinality fields like workspaceId and runId stay in the JSON body and are queried with | json at read time. The compose service name is also copied into a unit label (its value is now control, not the old coderunner.service — update any saved queries accordingly).
Starter LogQL queries
Find these under Explore → Loki datasource in Grafana Cloud:
# All logs from one student
{job="coderunner"} | json | workspaceId="alice-1"

# All errors
{job="coderunner", level="error"}

# Run lifecycle events with duration
{job="coderunner", category="control.runs"} | json
  | line_format "{{.message}} {{.workspaceId}} {{.durationMs}}ms"

# Container start failures
{job="coderunner", category="control.containers"} |= "failed"
To verify Alloy is shipping metrics, run this in Explore → Prometheus datasource:
up{instance="coderunner"}
This should return the control-plane and host (node) scrape targets, all 1.
Dashboards
A single pre-built dashboard, coderunner-ops.json ("CodeRunner — Ops"), lives in the dashboards/ directory at the repo root. It is designed for retroactive session review on a VM that is powered off most of the time: set the time range to cover a class session and read top to bottom. Its rows:
| Row | Answers |
|---|---|
| Host VM | Was the box big enough? Host CPU, memory, disk used % (/ and the data disk), network — from the Alloy node exporter. |
| Workspaces | Active workspaces, per-workspace CPU/memory %, container cold-start p95. |
| Runs | Runs by terminal status in 15-minute buckets, build duration p50/p95, run/failure/idle-stop totals over the selected range. |
| Control plane | Request rate by route, 5xx counts, HTTP + editor-proxy p95, event-loop lag, RSS. |
| Recent warnings & errors | Control-plane logs from Loki at warning and above. |
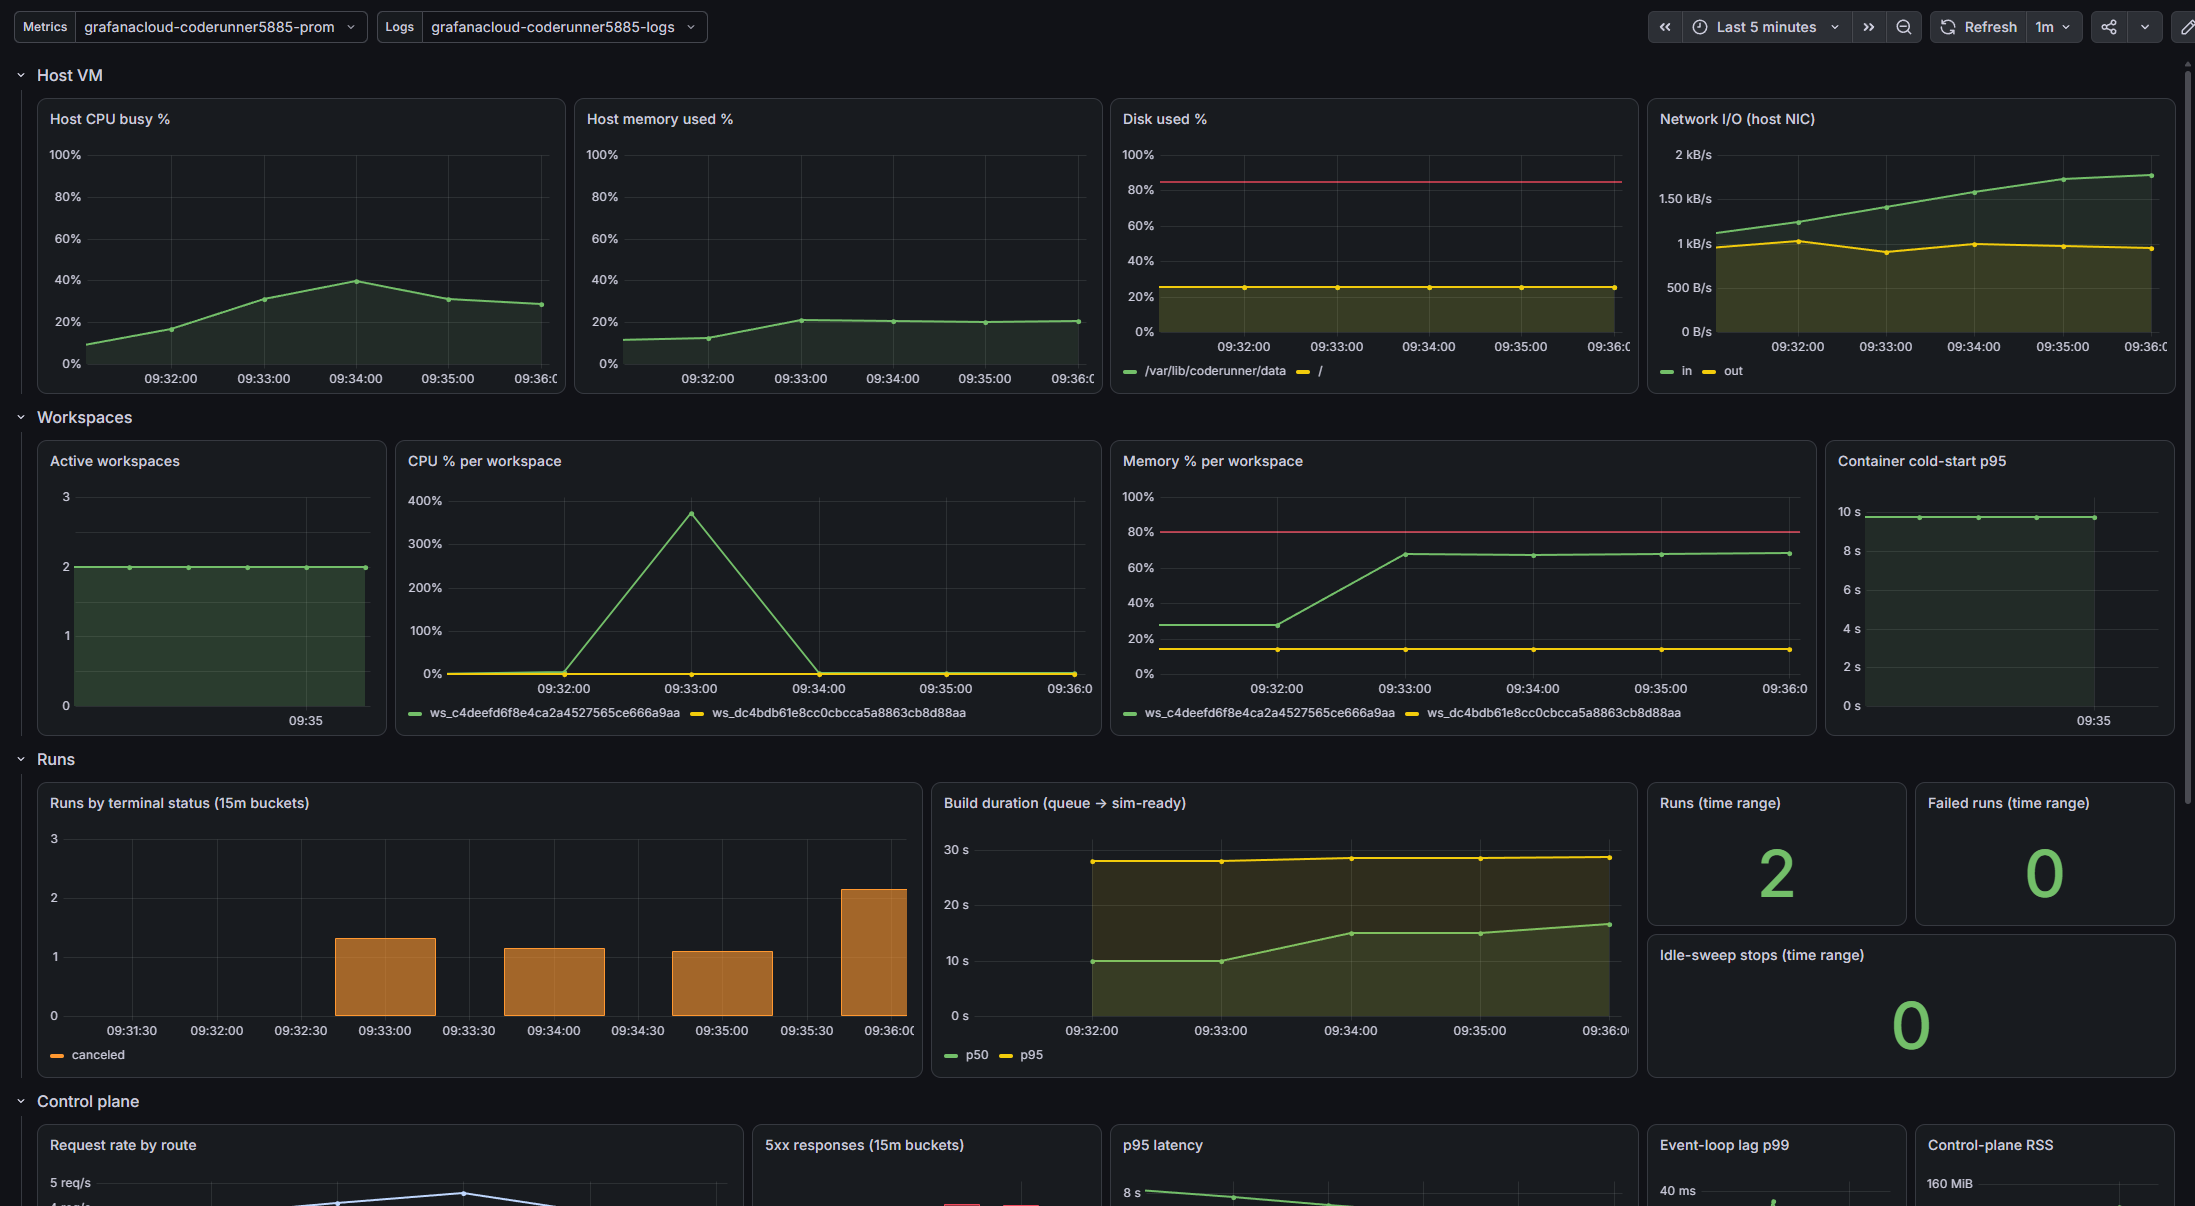
To import it, open Grafana Cloud, go to Dashboards → Import, and upload the JSON file, selecting your Prometheus and Loki datasources when prompted. The panels assume the metrics described in Monitoring. (Earlier releases shipped six narrower dashboards; they were consolidated into this one and can be recovered from git history if needed.)
Alloy config location
The rendered Alloy config lives at /opt/coderunner/alloy/config.alloy on the VM and is bind-mounted read-only into the Alloy container. It is regenerated from the template at /opt/coderunner/alloy/config.alloy.tmpl on every boot by render-env.sh, which substitutes secrets from GCP Secret Manager. Do not edit config.alloy directly; changes are overwritten on next boot. Edit the template instead, then run render-env.sh and docker compose up -d alloy.